Strides in Sustainability and How the Portfolio Could Benefit
The Portfolio Managers of the Hennessy Stance ESG ETF discussed portfolio changes and sector weightings.
-
 Bill DavisPortfolio Manager
 -
 Kyle BalkissoonPortfolio Manager
Information about the Hennessy Stance ESG ETF (the “Fund”), a semi-transparent actively managed exchange-traded fund ("ETF") with a Portfolio Reference Basket structure:
The Fund is different from traditional ETFs. Traditional ETFs tell the public what assets they hold each day. The Fund will not. This may create additional risks for your investment. For example:
- You may have to pay more money to trade the Fund’s shares. The Fund will provide less information to traders, who tend to charge more for trades when they have less information.
- The price you pay to buy Fund shares on an exchange may not match the value of the fund’s portfolio. The same is true when you sell shares. These price differences may be greater for the Fund compared to other ETFs because it provides less information to traders.
- These additional risks may be even greater in bad or uncertain market conditions.
- The Fund will publish on its website each day a “Portfolio Reference Basket” designed to help trading in shares of the Fund. While the Portfolio Reference Basket includes all the names of the Fund’s holdings, it is not the Fund’s actual portfolio.
The differences between the Fund and other ETFs may also have advantages. By keeping certain information about the Fund portfolio secret, the Fund may face less risk that other traders can predict or copy its investment strategy. This may improve the Fund’s performance. If other traders are able to copy or predict the Fund’s investment strategy, however, this may hurt the Fund’s performance.
For additional information regarding the unique attributes and risks of the Fund, see the Prospectus and SAI.
Key Takeaways
» The ETF held 36 positions as of 9/30/24.
» With a rotation away from mega-cap dominance, our models are overweighting Financial Services stocks while underweighting Technology.
» Many sectors have made strides, but as it relates to carbon reductions, the most important have been in Utilities and Industrials.
What changes were made to the portfolio after the latest quarterly rebalance?
Our portfolio construction process includes selecting companies we believe have values aligned with our investors, as well as those companies that have the potential to outperform and provide lower risk. Following the latest rebalance, fewer companies met that criteria compared to last quarter. Whereas the ETF had 44 positions as of June 30, 2024, it held 36 positions as of the end of the third quarter. We sold Broadcom, CVS, Freeport-McMoRan, and eBay as they no longer met our investment criteria.

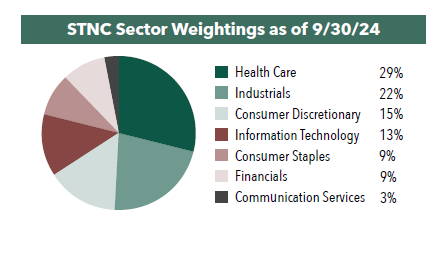
As it relates to sector weightings, the ETF has reduced its exposure to Information Technology and Communication Services, while increasing its exposure to Financial Services and Consumer Discretionary, compared to the previous quarter.
STNC typically is overweighted in Financial Services and underweighted in Technology compared to the category. Would you provide your perspective on both sectors?
With regard to the ETF’s overweight in the Financial Services sector, we are seeing the early stages of investors rotating away from mega-cap dominance. Combined with Federal Reserve signals to cut interest rates several times over the next year or two, this appears to be an environment that favors banking.
At the same time, in the Technology and Communication Services sectors, many stocks, especially mega-cap companies, have had a very strong run compared to the rest of the market. Given the degree to which they are highly correlated, our models are leaning away from that risk.
Why does the model favor mid-cap companies over their large-cap peers?
As of September 30, 2024, the ETF had a median market capitalization of $53.8 billion compared to the S&P 500® Index’s median market cap of $38.2 billion.
In most market environments, the companies in the bottom two-thirds of the S&P 500, from a capitalization weight perspective, have outperformed the top one-third. A proxy for this point is to look at the performance of the S&P 500® Equal Weight Index compared to the market cap weighted S&P 500 over the past 30 years. In general, the Equal Weight Index outperformed, and especially so after prolonged dominance of market cap weighting. Prior to the period between January of 2023 and June of 2024, for 20 straight years, the S&P 500 Equal Weight outperformed the overall S&P 500 (which is market cap weighted) by 300 basis points on an annualized basis.
What sector or industry has made the greatest strides from an ESG perspective over the past few years?
Many sectors have made strides, but as it relates to carbon reductions, the most important have been in Utilities and Industrials.
- Utilities: Approximately 30% of U.S. carbon emissions come from electricity generation, so Utilities companies play a critical role. In 2023, the sector achieved a net reduction of 3%, partly due to switching from coal to natural gas and solar energy. Xcel Energy, who manages utilities serving 6 million customers across 8 states, and NextEra Energy, who distributes power to nearly 6 million customers, are two companies that appear to be moving more aggressively toward decarbonization.
- Industrials. Within the Industrial sector, cement manufacturing and steel and iron production are responsible for massive carbon emissions. In fact, according to the World Economic Forum, global cement manufacturing produced 1.6 billion metric tons of carbon dioxide in 2022—about 8% of the world’s total CO2 emissions. Steel production accounts for about 7% of greenhouse gas emissions. Given their significant contributor to climate change, some companies are making changes to decarbonize at a faster pace than others.
- In this article:
- Stance ESG ETF
